02.07.2024
ET visualizations: everything you need to know about them
 by Mirta Mikac, Product Manager
Visualizations of eye tracking data are crucial for interpreting and understanding the patterns of visual attention and gaze behavior. Eye tracking data can be shown in various visualizations in addition to quantitative measurements. Here are some of the most typical methods for displaying eye tracking data which can also be used within our InsightLab software:
Heat Maps
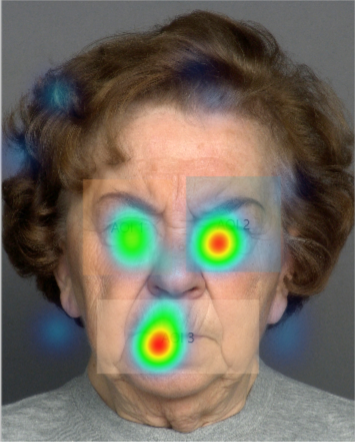
In eye tracking, heat maps visually represent the areas where a person’s gaze lingered the longest. They are created by overlaying a color gradient on a visual stimulus (an image or a video). Typically, the color gradient is green to red, with red indicating areas where the cumulative person’s gaze fixated the longest and green denoting regions with less fixation time.
Depending on their temporal type, they are either classified as static or dynamic. Static heat maps display the overall distribution of fixations, whereas dynamic heat maps provide a real-time depiction of the gaze pattern over time.
Given their characteristics, heat maps help understand the areas with the highest attention within a visual stimulus. They can identify an image or videos’s most salient or important parts. The heat map of the image below suggests that the most salient areas are around the mouth and right eye, while other parts of the image received little or no visual attention.
Heat maps are also used in web design and marketing to optimize the placement of important information and call to action. They allow comparisons between individual responses and participant groups, which helps determine how various populations may interpret a stimulus differently.
Scan Path
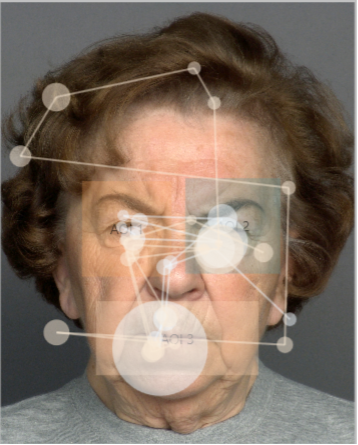
Scan path is a visualization technique used to represent the sequence of eye movements a person makes when looking at a visual stimulus, such as an image or video. It displays a series of fixations and saccades representing the person’s gaze behavior over time.
A fixation is a brief eye pause on a specific area of a visual stimulus, while a saccade is a rapid eye movement between fixations. Scan paths show each fixation and saccade’s order, duration, and location. They are represented as a sequence of circles and lines on an image or video, with each circle representing a fixation and the line representing a saccade. Longer fixations and saccades are usually represented by larger dots or longer lines, respectively.
The example below suggests that the most prolonged fixations were made in the area around the mouth and around the right eye, while other regions received shorter fixations.
This type of visual analysis can provide insights into the underlying cognitive processes and attention mechanisms involved in visual perception, such as search strategies, attentional biases, and visual memory.
AOI Analysis
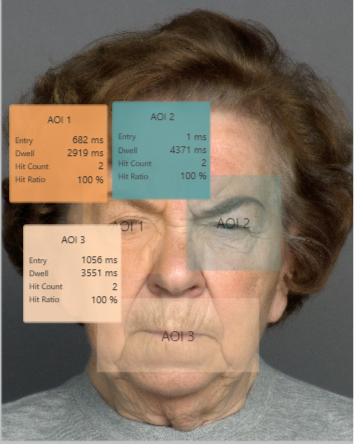
AOI stands for ‘Areas of Interest’, which define regions on a visual stimulus, such as an image or video, that are of specific interest for eye tracking research analysis. AOIs are defined by the researcher based on their research question and can take on any shape, size, time, or location on the visual stimulus.
By analysing eye movements within AOIs, researchers can gain insights into how people attend to and process different areas of the visual stimulus. AOI analysis can reveal how long people look at particular areas, how often they revisit particular AOIs, the order in which they fixate the AOIs, and how quickly they move their gaze between different AOIs. Due to the special definition, AOIs are statistically processed.
The image below is divided into three AOIs – around the mouth, left eye, and right eye. Eye tracking metrics for each AOI can be analyzed and compared between AOIs. A closer look at the metrics indicates that the subjects spent most of their fixation time on the right eye (dwell time of 4371 ms) while spending the least amount of time on the left eye (dwell time of 2919 ms). The hit count and hit ratio reveal that all tested subjects fixated on each AOI.
AOI analysis is a powerful tool in eye tracking research, as it enables researchers to answer specific research questions about how people attend to and process visual defined information. This analysis is commonly used in various fields, including marketing, web design, and human-computer interaction, to optimize the placement and presentation of visual stimuli.
Images used in InsightLab are taken from a database of facial expressions in young, middle-aged, and older women and men:
Ebner, Natalie.C., Riediger, Michaela, Lindenberger, Ulman. (2018). FACES: A database of facial expressions in young, middle-aged, and older women and men (publicly available datasets). Max Planck Society. https://faces.mpdl.mpg.de/imeji/collection/IXTdg721TwZwyZ8e